PROJECT
Measuring surface waves on the Swan River
Measuring surface waves on the Swan River
Status: Complete
Researchers
- Scott Draper
Associate Professor, Oceans Graduate School, UWA - Nicole Jones
Associate Professor, Oceans Graduate School, UWA - Matt Rayson
Research Fellow, Oceans Graduate School, UWA - Justin Geldard-Ker
- Leo Reith
Project Summary
This project involved the procurement of the equipment itself, selecting the ideal site location in the Swan River to replicate scaled prototype conditions, obtaining all relevant regulatory approvals for deploying equipment in the river in addition to the design of innovative and cost effective launch and retrieval procedures.
The data obtained from the field equipment was analysed and filtered to separate vessel generated waves (i.e. boat wake) from wind generated waves. These two separate sources of waves were then analysed in detail, both to characterise the wave climate for future model scale testing in the river and to understand the relative contribution of boat wake and wind waves on river processes.
Comparison of the measured wind waves was made with a numerical wave model developed for the Swan River.
Project Updates
Field trial of the Nortek Signature 1000 successful!
On Friday 24 June the new Nortek Signature 1000, a field measurement device was trialed to make long term measurements of waves, currents and turbulence in the river. The deployment was conducted just next to JoJo’s café, North of Nedlands Yacht Club. Long term (4 week) deployment was planned to begin in mid to late July.
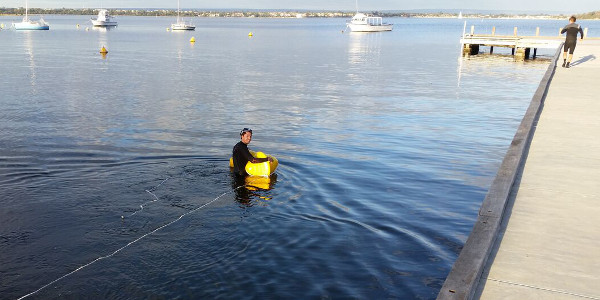
First field trial: The images show the Nortek Signature 1000 being tested in the Swan River by Justin (left) and Henning (right)
Long term deployment reveals wave characteristics in the Swan River
The long term (four week) was successfully completed in early September. The measurement window included four storms. Analysis of the data was undertaken by Justin, and conclusions were reached concerning:
1. The spectral properties of the waves, and how they compare to North West Shelf conditions
2. The short and long term wave statistics
3. Predictability of the waves as compared to a spectral wave model
The long term data set and Justin’s thesis are coming soon!
New Deployment Investigating Directional Spectra
The directional spreading of surface waves was investigated for a new set of wave data recorded during January 2017. Below is a figure of the study location and some example data. The directional spreading is currently estimated using the Fourier Expansion Method. Future work is exploring the Maximum Likelihood Method and a method based on second order wave interactions.
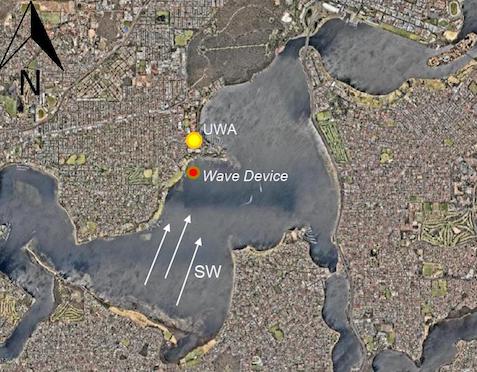
Figure 1: Location of wave device and direction of evailing winds during Summer.
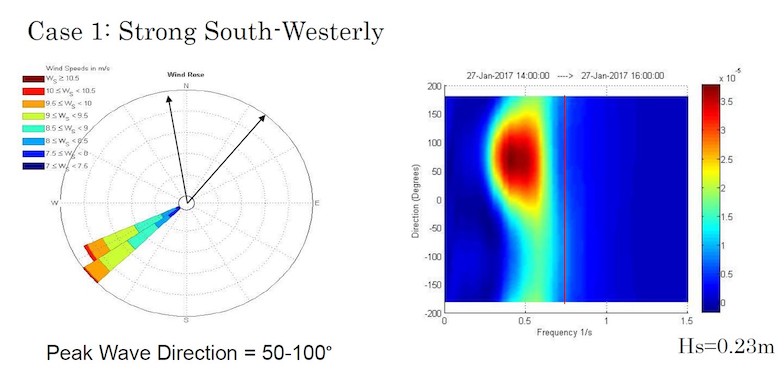
Figure 2: Some example output. Wind rose (left) shows a histogram of wind speed and direction ‘from’, together with the mean wave direction ‘towards’ (bounded by the black arrows). The spectrum (right) indicates the directional distribution of variance density. Vertical redline indicates the highest frequency that can be analysed using the wave device.