
By Associate Professor Paul J. Maginn, Director, UWA Public Policy Institute
Age of the octogenarian
There has been a seismic shift in Australia’s population size and structure. Between 1911 and 2025 Australia’s population grew from 2.3 million to 27.2 million – an average increase of 9.4 per cent per annum.
According to the UN (2024) life expectancy in Australia is 84.1 years – males 82.3 and females 85.5. In terms of age structure, in Western Australia 21.6 per cent of the population is aged 60 and over.
Old-age dependency
The Australian Government’s (2023) Intergenerational Report notes that population ageing is one of the major forces shaping Australia’s future. This is reflected, for example, in the ‘old-age dependency ratio’. That is, the number of people aged 65 and over for every 100 people of traditional working age (15 to 64 years).
Gazing into the future, population projections show the old-age dependency ratio at the national level will increase to 48.9 by 2071.
In WA, it is projected to rise to 50.4 and even higher in South Australia (55.3) and Tasmania (59.0).
Geographies of ageing
Since the majority of Australians live in metropolitan regions the implications of ageing will be more visible there. This does not diminish the impacts of ageing in regional and remote Australia.
From a place-based policy perspective, mapping the geographies of ageing over time and at different scales is instrumental for informed policy-thinking, strategic planning and policy action in creating more age-friendly cities.
This is especially true for areas with rapidly growing cohorts in their 70s and 80s.
Ageing across WA
Australian Bureau of Statistics data on WA’s estimated resident population at the SA4 level shows the majority of West Australians in 2001 aged 60-69 years (73.1%),
70-79 years (70.7%) and 80+ years (71.4%) lived in the Perth metropolitan region.
More specifically, the north-west of Perth had the most people in the oldest cohorts. The south-east of Perth had the largest number of people aged 80-plus, closely followed by the north-east of Perth.
By 2024, the north-west of Perth had become the dominant hotspot for all three aged cohorts with increases of 94.4 per cent, 130.5 per cent and 141.3 per cent respectively.
Localised ageing hotspots
Drilling down to more localised hotspots of high old-age dependency ratios, the highest ratios tend to be in regional WA, with the top three locations identified as York-Beverley, Toodyay and Pemberton.
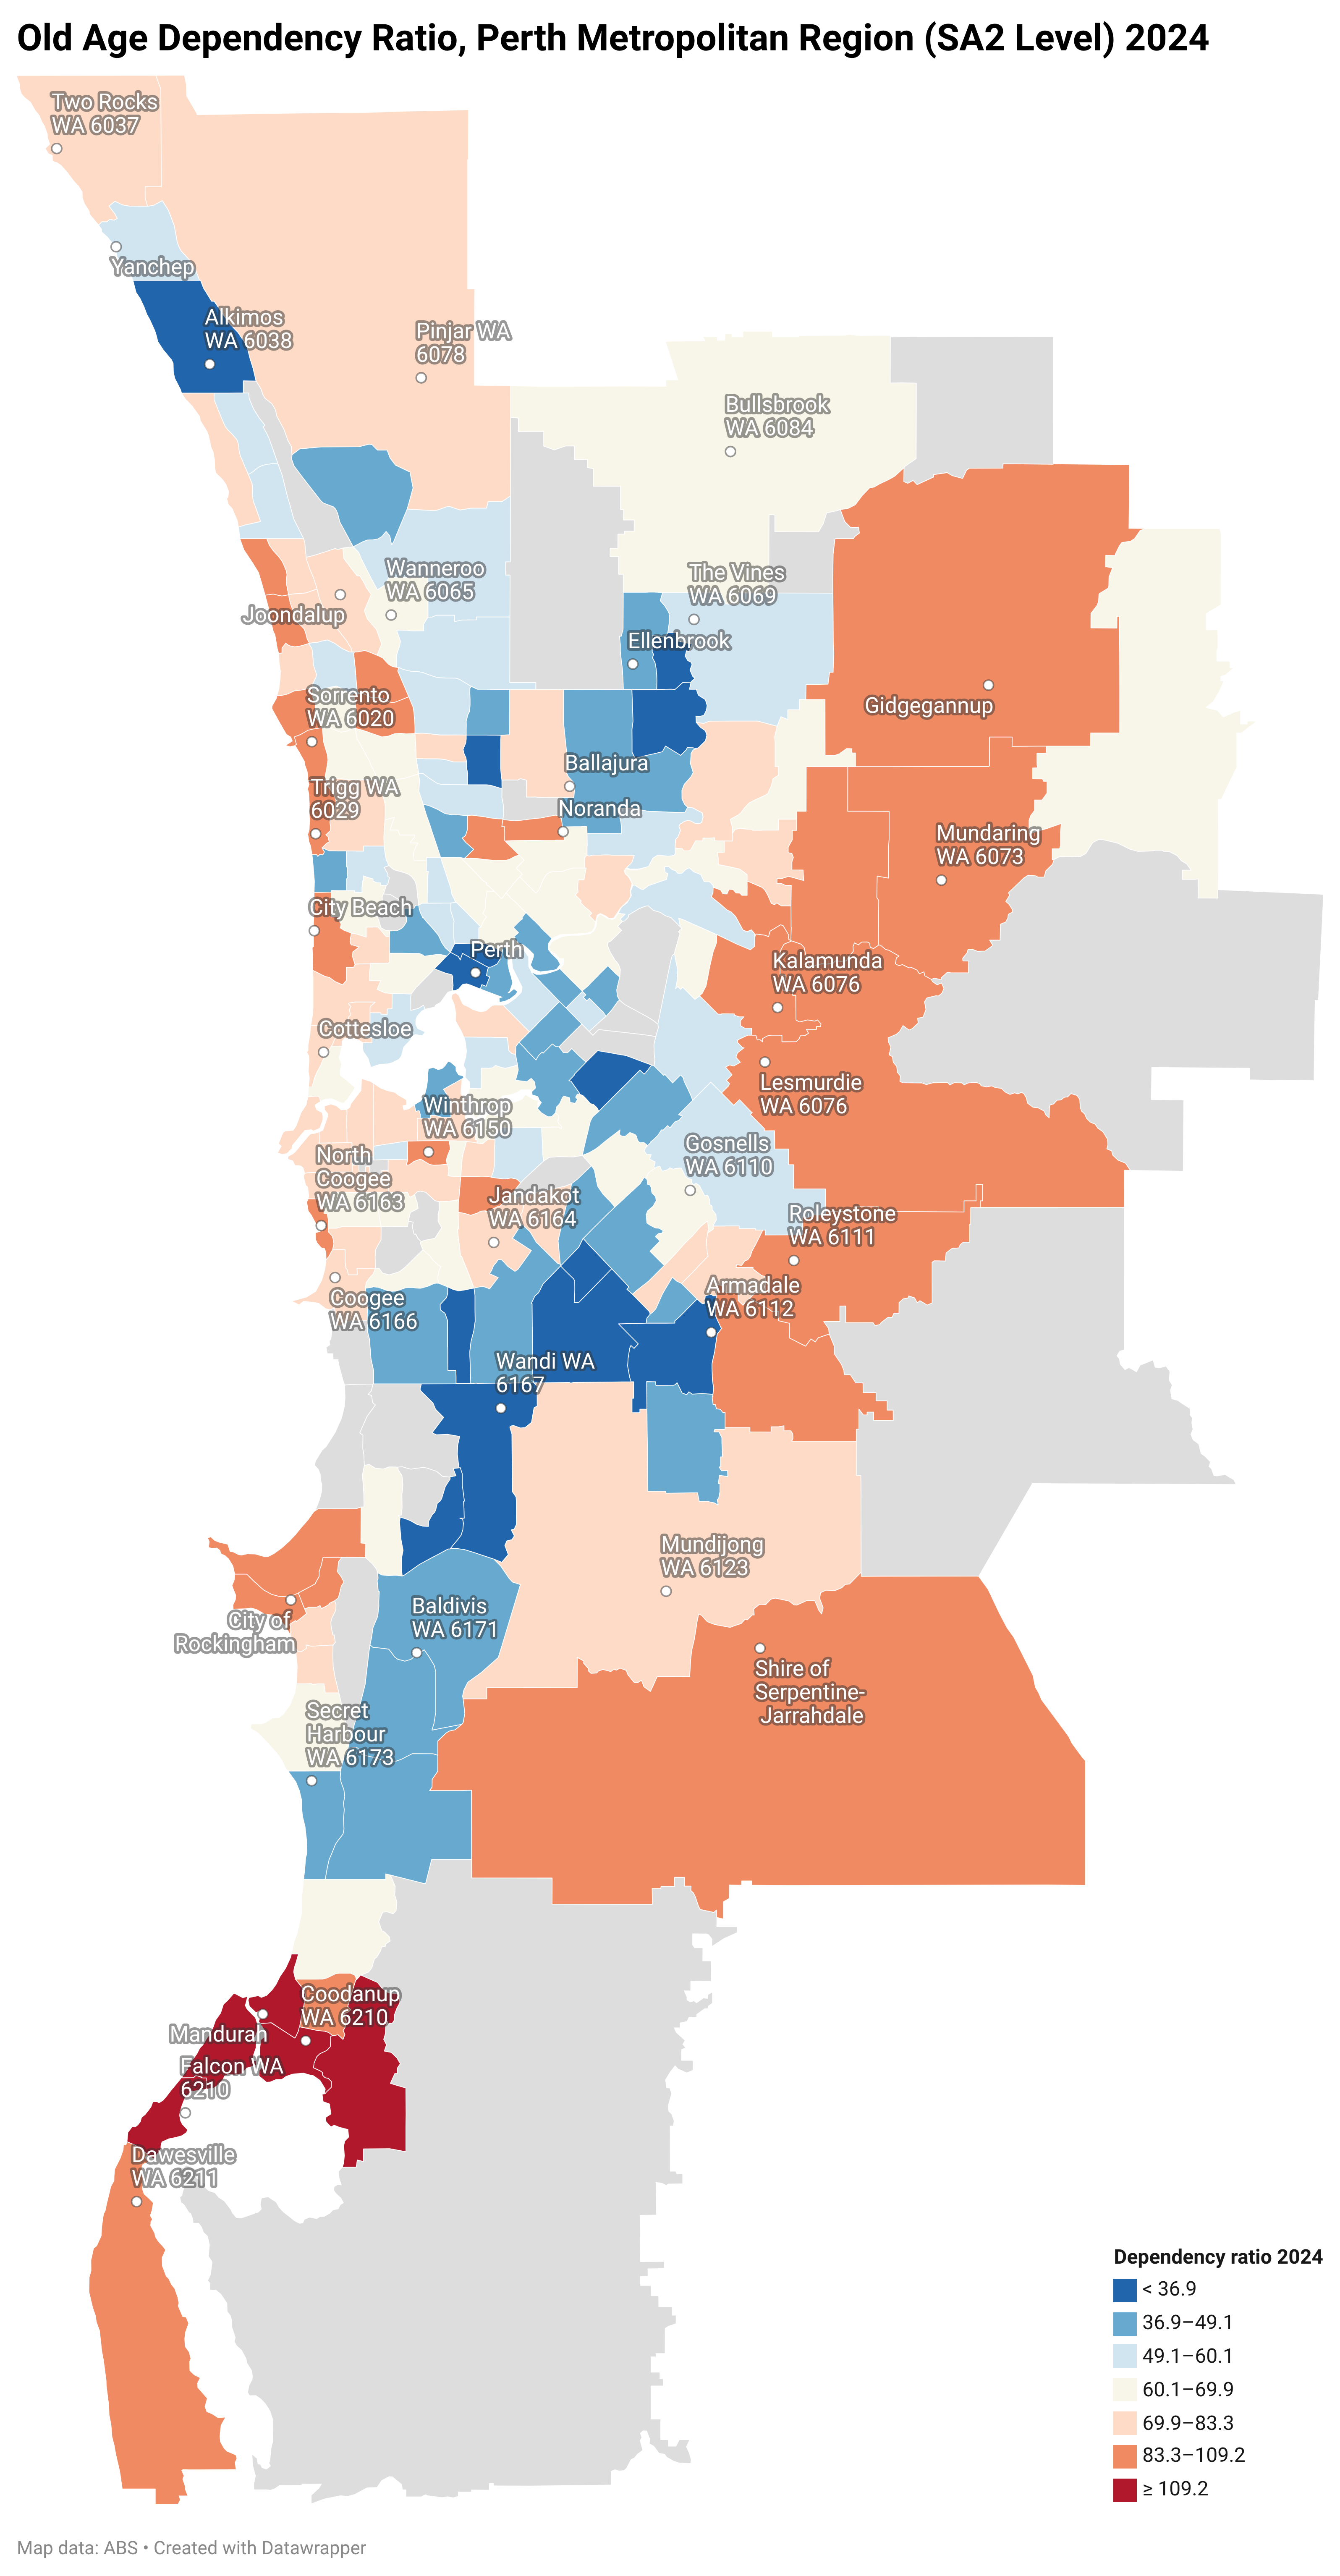
Within this demographic in metropolitan Perth, the highest old-age dependency ratios were all concentrated in the outer southern metropolitan region.
Old-age dependency ratios tend to be more pronounced in outer metropolitan Perth including along the eastern metropolitan fringes and the coastline from Cottesloe to Iluka-Burns Beach.
Relatively lower old-age dependent ratios are found in inner-Perth including Northbridge and Highgate and along the inner south-east and south corridors.
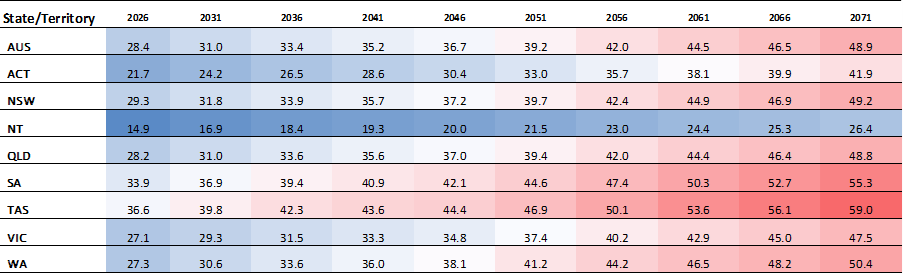
Australian Bureau of Statistics Data Explorer
Projections based on (i) low fertility rate; (ii) high life expectancy; (iii) medium net overseas migration; and (iv) medium inter-state migration flows.
Key policy implications
The overall ageing of the population, rapid growth of older age cohorts and high old-age dependency ratios pose a series of inter-related policy questions at the national, state, metropolitan, local government and suburban scales.
- economic, taxation and fiscal policies – how will governments generate sufficient revenue via taxation (eg income tax and GST) if the working age population shrinks relative to the growth of the aged population?
- service delivery in health and social care – where will the labour force come from to provide good quality medical, health and social care for a growing aged population?
- familial structures and relationships – are Australians ready for a significant growth in intergenerational households and at-home aged-care responsibilities?
- physical design and liveability of cities/regions – how will our cities and regions adapt to ensuring a good quality of liveability, accessibility, mobility and participation for older populations in terms of housing, transport, built environment and employment?
- social and civic participation – what measures are needed to ensure that older populations are not excluded from opportunities to participate in social, civic and economic life and maintain well-being?
Policy silver linings
Responding to these policy challenges is part of the State Government’s agenda and evident in the Creating Age-friendly Communities in WA Toolkit (2021) and An Age Friendly WA: State Seniors Strategy 2023-2033.
If current life expectancy levels and socio-economic standards are sustained, this offers a silver lining in that the growing number of people in their 70s and 80s in the future will be relatively more active, healthier and participatory cohorts.
Read the full issue of the Winter 2026 edition of Uniview [Accessible PDF].